

Most software buying decisions start with a list of features. With utility asset management software, that’s the wrong starting point.
The real question is simpler: which asset in your network is most likely to fail in the next 12 months? And what will it cost when it does?
If that answer lives in a spreadsheet or someone’s head, you have a gap.
Here’s what fills it, how the core capabilities actually work, and whether a purpose-built platform is genuinely necessary.
What Is Utility Asset Management Software?
Utility asset management (UAM) software tracks condition, maintenance history, and replacement timelines for physical assets like pipes, grids, and treatment plants.
It’s designed specifically for assets that are widely distributed, costly to replace, and heavily regulated.
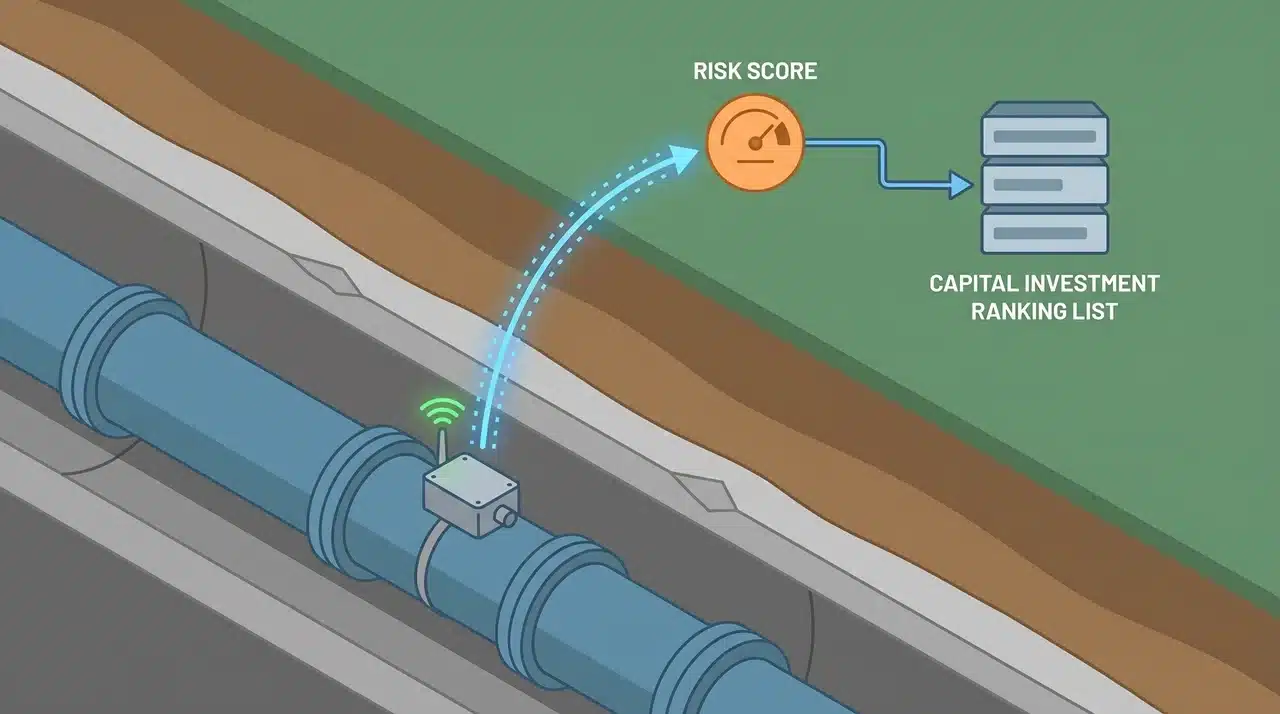
While a CMMS manages work orders, UAM goes further by connecting field-collected condition data to risk scores. These scores guide capital investments and replacement planning, ensuring asset life is extended based on evidence, not guesswork.
The difference is clearest in compliance reporting and spatial data. A generic CMMS has no built-in capability in either area.
UAM software builds a complete chain, from field monitoring to capital decision-making.
What Does Utility Asset Management Software Actually Do?
UAM software is built around a set of capabilities that work together. Each one handles a specific layer of the problem.
Together, they close the gap between field data and capital decisions.
- Predictive and Preventive Maintenance: Preventive maintenance follows a fixed schedule. Predictive maintenance uses live sensor readings to identify assets trending toward failure. The result is fewer unnecessary interventions and earlier detection of real problems.
- GIS Integration: Links condition data to asset locations. Your team can prioritize by geography, starting with the highest-risk service areas rather than assessing each asset in isolation.
- SCADA Integration: Connects the platform to your supervisory control systems. Operational readings from pumps, valves, and grid equipment feed directly into each asset’s condition profile — automatically, without manual logging. This matters most for assets that run continuously and degrade between inspections.
- IoT and Sensor Monitoring: Embedded sensors on pipes, transformers, and pumping stations feed continuous readings into the platform. Pressure, vibration, temperature, flow rate — all captured automatically. When a reading crosses a defined threshold, the system flags the asset and updates its condition score. Maintenance responds to what the asset is doing now, not a schedule set when it was new.
- Regulatory Compliance Automation: Captures inspections, condition records, and incident reports automatically. Every entry is timestamped and retrievable, which is what auditors actually need.
- Lifecycle Cost Optimization: Combines replacement cost, estimated remaining useful life, and failure probability to rank capital investments. A 70% failure probability on a $40K replacement ranks differently than a 30% probability on a $2M asset. That ranking makes it possible to defer a replacement with confidence. Or accelerate one in time to avoid emergency pricing.
Each capability is most useful when the others are in place. A sensor reading triggers a work order. That work order logs against a GIS location. It timestamps automatically for the next compliance audit.
That’s the full picture.
How Work and Asset Management Connect in UAM
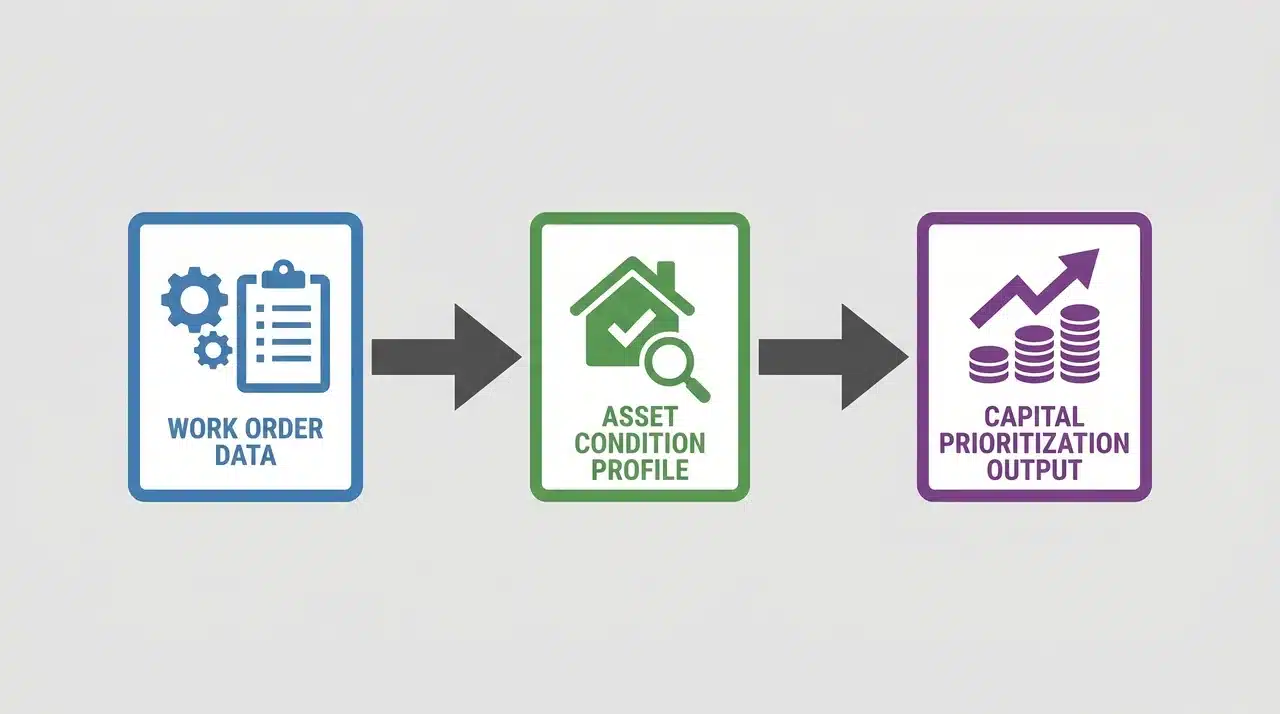
Every inspection, work order, and maintenance activity generates data. In a CMMS, that data closes a ticket.
In a UAM platform, it updates the asset’s condition profile and flows forward into capital planning.
A technician who replaces a failing pump seal in the field isn’t just closing a task. That repair timestamps against the asset and updates its condition score.
Depending on what the data shows, it can shift the replacement date forward or back.
Capital planning models that used to rely on age-based assumptions start drawing from real maintenance history instead. The practical result: a work order completed today changes what the capital plan recommends next year.
How Do the Leading Platforms Compare?
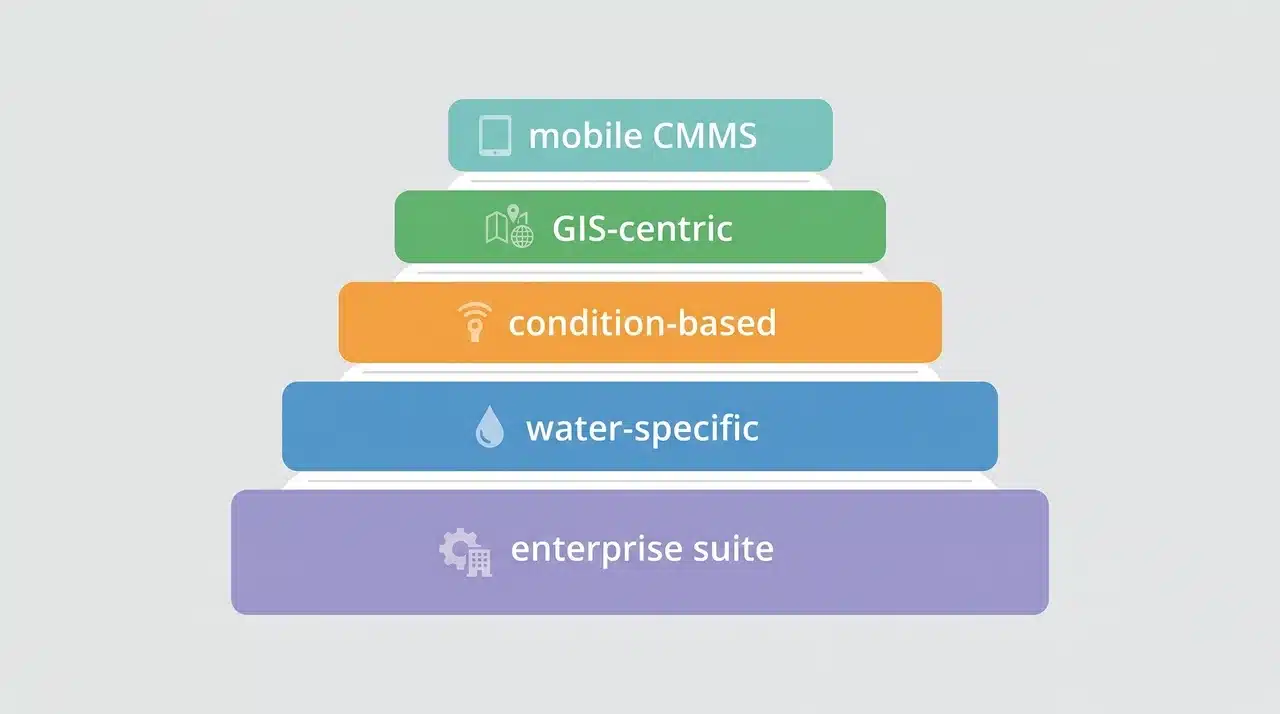
Not all utility asset management platforms are built the same way. They sit in five distinct tiers. Choosing from the wrong one is one of the most costly mistakes.
1. GIS-Centric Platforms (Esri ArcGIS, Cityworks)
These platforms started as spatial analysis tools. Asset management came later, and that history shows in how they’re built.
If your primary need is spatial like location-based risk, service area mapping, or network analysis, these are built for it.
Where they fall short is condition-based scoring. Spatial context is excellent. Asset health modeling is not their core strength.
2. Condition-Based Maintenance Platforms (DNV Cascade)
Cascade is built specifically for electric utilities. That specificity shows in every part of how it works.
The core function is an Asset Health Index, a continuous risk score built from real-time data across your grid. Instead of scheduling inspections on a calendar, the platform tells you which assets are degrading and how fast.
If you’re running an electric network and asset failure has direct service consequences, this tier exists for exactly that situation.
3. Water and Wastewater Platforms (OpenGov)
Water utilities face problems that the other tiers don’t fully address. Aging infrastructure, constrained budgets, and funding cycles that require long-range capital planning are specific challenges.
OpenGov is built around that reality. Budget forecasting, replacement planning, and funding documentation are core functions, not add-ons.
It’s less about real-time condition monitoring and more about making defensible long-term investment decisions.
4. Enterprise Asset Management Suites (IBM Maximo, Oracle WAM, SAP EAM)
These are full-lifecycle operating systems. They handle asset management, procurement, finance, workforce, and compliance, all connected in one environment.
The trade-off is complexity. Implementation takes longer and configuration requires more resources.
For a large utility running cross-departmental operations, that integration pays off. For a mid-size utility that needs strong asset tracking, it’s often more than the problem requires.
5. Mobile-First CMMS Tools (Limble, eMaint, Fiix)
These tools handle maintenance workflow extremely well. Work orders, technician scheduling, real-time field reporting, fast to deploy and easy to use.
The ceiling shows up when you need spatial data, capital planning, or compliance documentation at scale. A 500-asset water system with one maintenance crew will often run cleanly on a mobile CMMS for years.
The limit becomes visible when a capital committee asks why you’re replacing a main now instead of in three years. The CMMS has no cost modeling or condition history to answer that.
When Is a Dedicated UAM Platform Necessary?
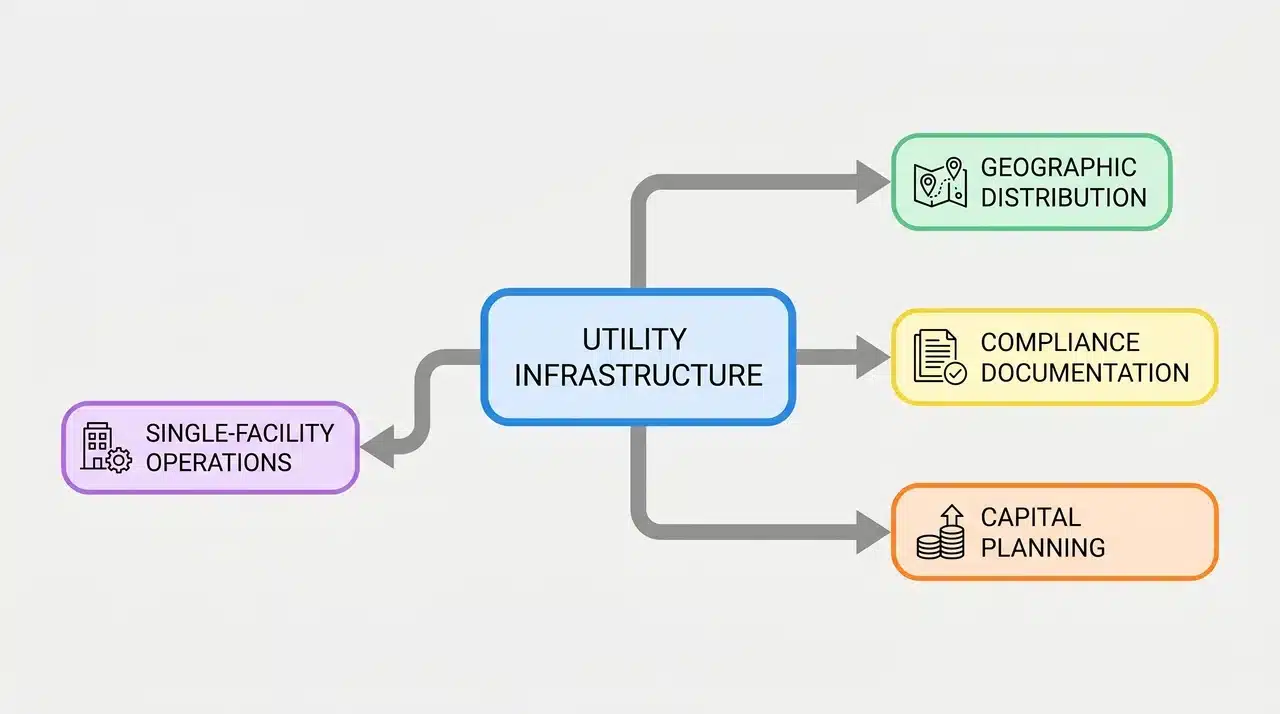
The tier comparison above shows what each platform does well. The more useful question for most operators is simpler: at what point does a well-configured CMMS stop being enough?
Three situations consistently push utilities past that threshold.
- Widespread Operations: When assets span hundreds of miles, prioritizing without location context means responding to whoever called first. That’s not risk-based management. GIS-linked UAM solves that directly.
- Regulatory Compliance: Structured, timestamped, auditable documentation isn’t a best practice for most utilities — it’s a license condition. Manual record-keeping doesn’t hold up at scale, and it doesn’t survive a serious audit.
- Capital Planning: If a replacement decision involves seven figures, it needs a defensible data foundation. Remaining asset life, failure probability, and cost modeling are the minimum. A maintenance log doesn’t provide them.
Smaller utilities and single-facility operations are the clear exception. If your asset inventory is tight and your team is small, a well-configured CMMS often handles the job.
The overhead of a full UAM platform won’t pay back at that scale.
Wrapping Up
Utility infrastructure doesn’t fail all at once. It degrades quietly, asset by asset, until something forces a decision.
The right utility asset management software doesn’t just log that degradation. It converts it into a ranked action plan, while there’s still time to act on the lowest-cost option.
What you choose matters less than choosing at the right tier. Match the platform to the actual problem: spatial complexity, compliance burden, capital planning horizon, or operational scale.
If you’re still unsure where your current tools fall short, start here: Where did your last reactive maintenance event originate? That answer usually points directly to the gap.
Frequently Asked Questions
What is the difference between utility asset management software and a CMMS?
A CMMS handles maintenance tasks and work orders. Utility asset management software adds condition tracking, lifecycle cost modeling, GIS and SCADA integration, IoT sensor monitoring, and structured regulatory reporting. The key difference: a CMMS closes tickets. A UAM platform uses those same activities to build an asset health picture that drives capital decisions.
Which utility asset management software is best for water utilities?
OpenGov is built specifically for water utilities, with budget forecasting, replacement planning, and funding documentation as core features. Esri ArcGIS or Cityworks suits operations where spatial network management is the priority. IBM Maximo or Oracle WAM fits large utilities running integrated cross-departmental operations.
Does utility asset management software integrate with IoT sensors?
Yes. Sensors installed on pipes, pumps, or grid equipment transmit continuous readings like pressure, vibration, and temperature into the platform. When a reading crosses a defined threshold, the system flags the asset and updates its condition score. That score triggers a work order, replacing a fixed inspection schedule with a response based on actual asset behavior. The result is fewer unnecessary maintenance runs and earlier detection of assets trending toward failure.
How does GIS integration improve utility asset management?
GIS links every asset to its physical location. Your team can prioritize by geography. You identify which service areas carry the highest risk concentration, rather than treating each asset as an isolated record. It also supports infrastructure network analysis, so a failure in one segment can be mapped against everything connected to it.