


You’ve probably searched for the best AI for statistics expecting a simple answer. Maybe a tool name you can pick and start using right away.
But when I started looking into this, I realized statistics isn’t one single task. You’re solving formulas, analyzing data, or trying to understand results, and each one needs a different approach.
That’s where you start running into problems. One tool works for you in one case, then falls short in another.
I’ll help you understand how these tools actually work, where they fit, and how you can choose the right one based on what you need.
What You Should Know Before Choosing an AI for Statistics?
Statistics tasks may look similar on the surface, but they’re not.
Some require exact calculations, others involve working with messy data, and some are about understanding results. The tool you choose needs to match the type of task, not just the subject.
This is where most people go wrong. They pick one tool and expect it to handle everything, which usually leads to confusion or incorrect results.
Before going through the list, keep this in mind: the “best” AI is the one that fits your specific task, not the one with the most features.
Best AI for Statistics Based on What You Need
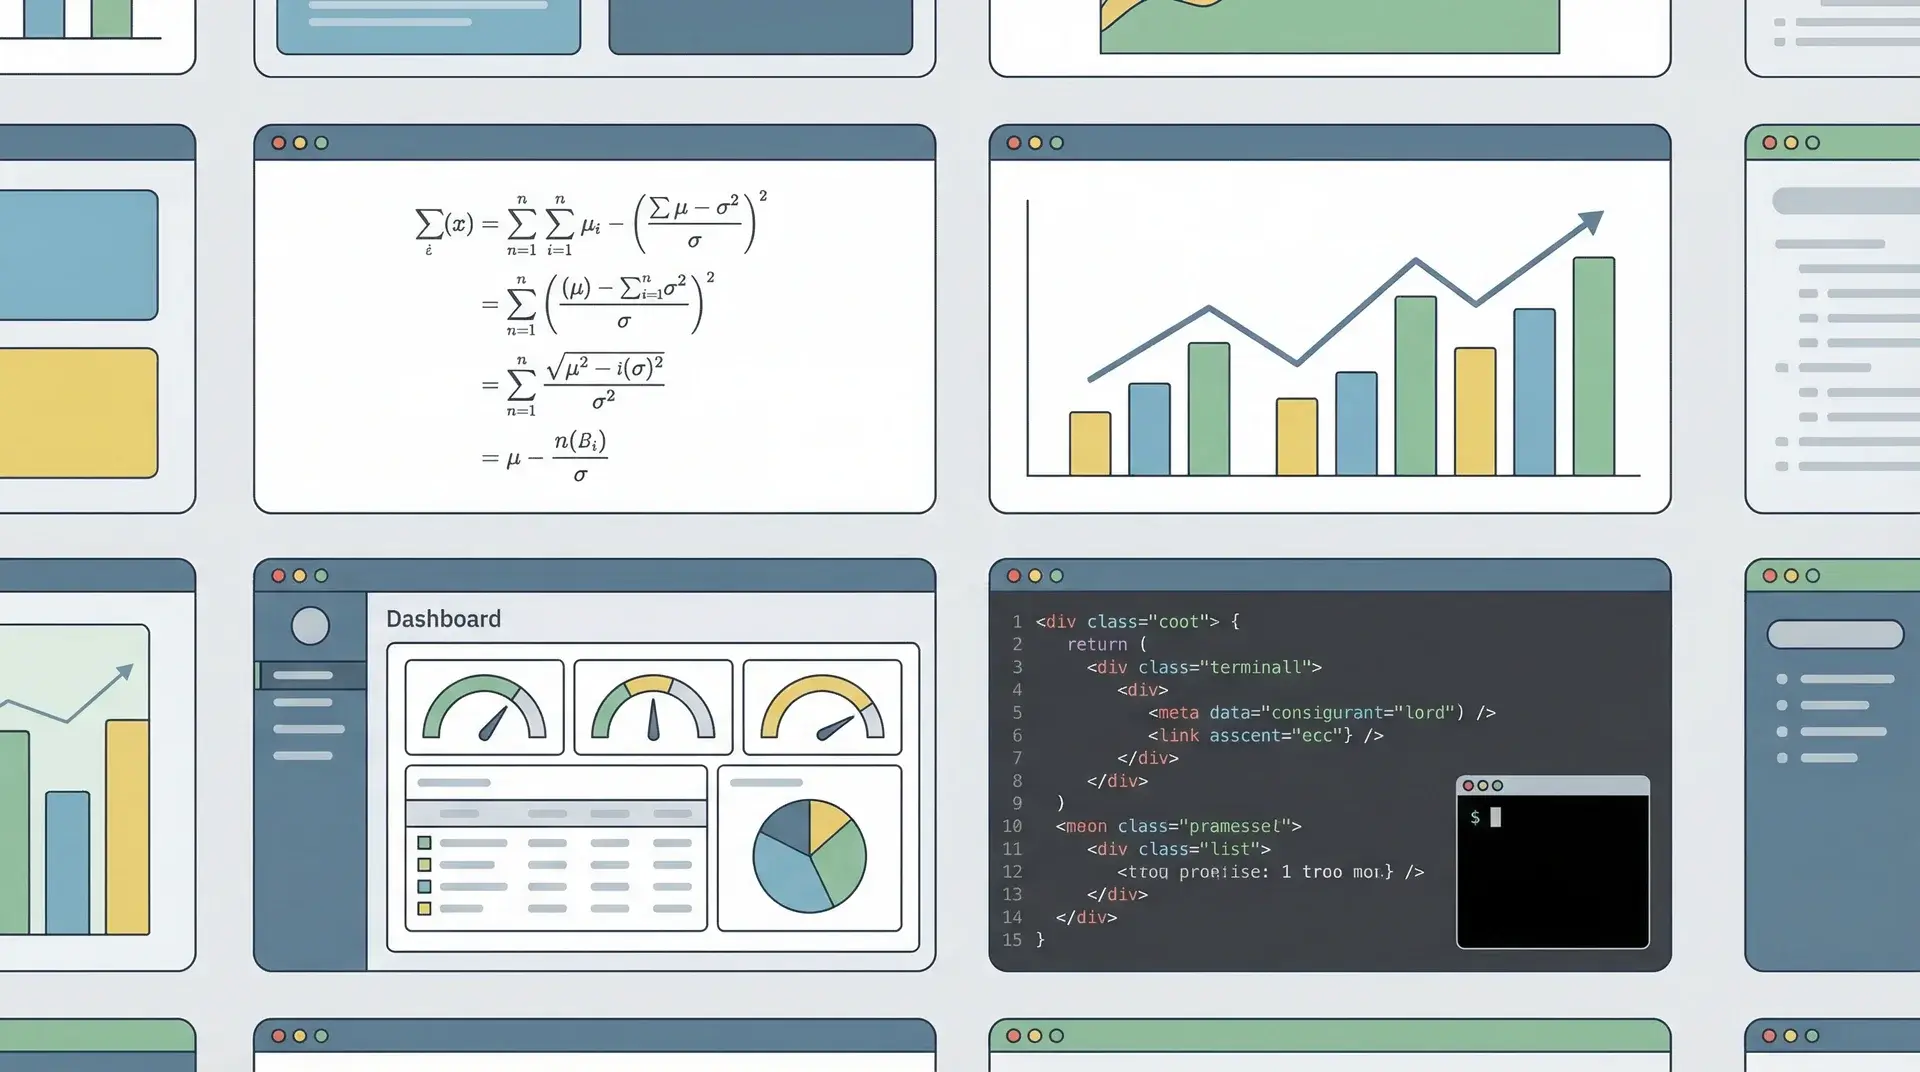
There isn’t one single best AI for statistics. The right choice depends on what you’re trying to do.
Some tools are built for solving formulas. Others are better for analyzing data or explaining concepts. If you try to use one tool for everything, that’s where problems start.
1. Wolfram Alpha
Best for exact calculations and step-by-step solutions. It uses a rule-based system, so it follows strict mathematical logic instead of guessing.
That makes it very reliable for probability, distributions, and hypothesis testing. It struggles when the question is unclear or loosely written.
- Best for: Exact answers, distributions, probability
- Strength: High accuracy due to symbolic computation
- Limit: Needs precise input
2. Symbolab
Best for solving equations and learning steps. Symbolab focuses on breaking problems into smaller steps, which helps you understand the process, not just the answer.
It’s useful for students working through statistics formulas, more learning-focused than advanced analysis.
- Best for: Step-by-step learning
- Strength: Clear breakdown of methods
- Limit: Limited to complex statistical models
3. Microsoft Math Solver
Best for quick problem-solving, especially on mobile. You can scan handwritten or printed problems and get solutions instantly.
It works well for basic statistics and classroom-style questions, fast, but it is not built for deeper analysis.
- Best for: Quick answers, mobile use
- Strength: Easy input (scan or type)
- Limit: Limited depth
4. ChatGPT (Advanced Data Analysis)
Best for flexible data analysis and code-based tasks. It can write and run Python code, analyze datasets, and explain outputs.
This makes it very useful for real-world statistical work. However, accuracy depends on how clearly you guide it and review outputs.
- Best for: Data analysis, coding, interpretation
- Strength: Flexible and multi-purpose
- Limit: Requires validation
5. Julius AI
Best for simple data analysis without coding. You can upload a dataset and ask questions in plain language.
It generates charts and summaries, which makes it beginner-friendly. It works well for quick insights but may struggle with deeper statistical modeling.
- Best for: No-code analysis
- Strength: Easy to use
- Limit: Not ideal for complex models
6. Tableau (AI Features)
Best for visualization and dashboards. Tableau uses AI to help you explore trends and build visuals from your data.
It’s widely used for presenting statistical results clearly. It focuses more on insights and presentation than on detailed statistical computation.
- Best for: Data visualization
- Strength: Strong visual outputs
- Limit: Limited statistical depth
7. Dataiku
Best for collaborative data science workflows. It combines data preparation, analysis, and machine learning in one platform.
This makes it useful for teams working on larger statistical projects. It requires setup and some learning before you can use it effectively.
- Best for: Team-based analysis
- Strength: End-to-end workflow
- Limit: Learning curve
8. IBM SPSS Statistics
Best for traditional statistical analysis. SPSS is widely used in research, especially in the social sciences.
It handles regression, hypothesis testing, and structured analysis very reliably. It’s less flexible than coding tools but easier for standard workflows.
- Best for: Research and academic work
- Strength: Reliable statistical methods
- Limit: Limited customization
9. Python (with AI tools like Copilot or ChatGPT)
Best for advanced and customizable analysis. Python gives full control using libraries like pandas, NumPy, and statsmodels.
AI tools help speed up coding and debugging. It’s powerful, but you need some basic coding knowledge.
- Best for: Advanced analysis
- Strength: High flexibility
- Limit: Requires learning
10. R (with AI assistance)
Best for statistical modeling and academic research. R is built specifically for statistics, which makes it very strong for modeling and data analysis. With AI assistance, it becomes easier to use, but it still has a learning curve.
- Best for: Statistical modeling
- Strength: Designed for statistics
- Limit: Steeper learning curve
11. Claude / Gemini
Best for explanations and concept clarity. These tools help explain statistical ideas in simple language and guide your thinking.
They’re useful for understanding concepts, but they don’t always produce reliable calculations.
- Best for: Learning concepts
- Strength: Clear explanations
- Limit: Not reliable for precise results
Each of these tools works well in the right context. The key is matching the tool to your task instead of expecting one tool to handle everything.
Quick Overview: The Right AI for Your Statistics Task
Most people don’t actually struggle with AI tools. The real problem is not being clear about the task. Once you define what you need, the choice becomes much easier.
| Task Type | Best AI Options | Strength | Limitation |
|---|---|---|---|
| Solving Formulas & Problems | Wolfram Alpha, Symbolab, MS Math Solver | Accurate, step-by-step answers | Needs clear input |
| Data Analysis & Visualization | ChatGPT (ADA), Julius AI, Tableau | Works with datasets, creates insights | Depends on data quality |
| Explaining Results | ChatGPT, Claude, Gemini | Simple explanations, easy understanding | May miss context |
| Modeling & Workflows | Python, R, Dataiku, SPSS | Handles complex analysis, full control | Requires learning |
This table gives you a quick way to match your task with the right type of AI, so you can avoid using the wrong tool and getting misleading results.
What Makes Some AI Tools Better for Statistics than Others

Most guides skip this part, but this is where the real difference shows up. Different AI tools don’t process statistical tasks the same way, which directly affects accuracy, reliability, and failure points.
- Symbolic math engines: Follow strict rules from input to exact output, making them highly accurate for calculations and defined problems, but they fail when the input is vague.
- Code-execution AI: Generates and runs code for flexible analysis, but accuracy depends on correct code and clean data, which can make results misleading.
- Language models: Explain concepts and interpret results well, but rely on patterns rather than true calculation, so subtle errors can occur.
- Hybrid platforms: Combine analysis, data handling, and collaboration, making them strong for workflows, but they require setup and user familiarity.
Each approach has a clear role, and choosing the right one depends on matching it to the kind of statistical task you’re handling.
Free vs. Paid AI Tools for Statistics
This is not just about cost. It directly changes what the tool can actually do and how far you can push your analysis.
| Aspect | Free AI Tools | Paid AI Tools |
|---|---|---|
| Best For | Small problems, basic explanations, simple datasets | Complex tasks, deeper analysis, professional use |
| Capabilities | Limited data handling and basic features | Larger datasets, code execution, and advanced analysis |
| Performance | Works well for light and occasional use | Handles heavy workloads and repeated analysis |
| Accuracy Impact | Can be sufficient for simple tasks, but may fall short in depth | More reliable for complex and high-stakes analysis |
| Limitations | Data size limits, restricted features, and lower processing depth | Requires cost, sometimes more setup or learning |
As tasks become more complex and accuracy becomes more important, the gap between free and paid tools becomes much more noticeable.
When AI Gets Statistics Wrong?
This is important to understand clearly. AI does not fail randomly; it tends to fail in predictable patterns, especially when the task involves interpretation or messy data.
One common issue is errors in statistical interpretation, where the AI may misread the question or apply the wrong method. Another is data and context limitations, where incomplete datasets lead to misleading results.
Many tools also sound confident, but confidence does not equal accuracy. Because of this, you should always verify key calculations, assumptions, and final conclusions, since human judgment is still essential for reliable results.
Tips for Using AI in Statistics Effectively
Using AI for statistics can save time, but only if you use it the right way. Small mistakes in input or interpretation can lead to wrong results.
- Be clear with your input: Write precise questions or provide clean data. Vague input often leads to incorrect outputs.
- Choose the right tool for the task: Use calculation tools for formulas and data tools for datasets instead of relying on one tool for everything.
- Always verify results: Double-check key calculations, assumptions, and conclusions before using them.
- Break complex problems into steps: This makes it easier for the AI to process and reduces errors.
- Understand the output, don’t just copy it: Make sure you know how the result was reached.
Using AI this way helps you avoid common mistakes and get more reliable results from your analysis.
Wrapping Up
Choosing the best AI for statistics becomes much simpler once you stop looking for one perfect tool, because different tasks need different systems and that’s the core idea to keep in mind.
Some tools are built to calculate, others to analyze, and some to explain, and problems usually begin when you expect one tool to handle all three without trade-offs.
If you match your task to the right type of AI, the results improve quickly and the confusion starts to fade.
It really comes down to one simple question: what exactly am I trying to do? Once that’s clear, the right choice tends to follow naturally.