


A good customer score can look reassuring, but it does not always tell you why people stay, leave, or struggle. That gap can make it hard to know what needs attention first.
I think the best way to make sense of customer feedback is to connect each number with a clear purpose.
Customer satisfaction metrics help you measure satisfaction, loyalty, effort, service quality, retention, and buying behavior in a more useful way. Much of this data lives wherever a company tracks customer records, so the way teams organize that information in tools like CRM software often shapes how clearly these metrics come through.
You can compare CSAT, NPS, CES, FCR, churn, retention, complaints, response time, CLV, and other key measures. I also explain what each metric tracks, how it is calculated, and when it makes sense to use it.
What Are Customer Satisfaction Metrics?
Customer satisfaction metrics are measurable values that show how customers feel about a company, product, service, or interaction. Some come directly from customer surveys, while others use service records or customer behavior.
CSAT measures satisfaction with a specific experience. NPS focuses more on loyalty and recommendations. CES measures how easy it was for someone to complete a task.
Other customer experience metrics add useful context. Retention shows how many customers stay, churn tracks how many leave, and complaint rates point to recurring problems.
Many of these signals also feed into a company’s broader marketing technology stack, since satisfaction data often informs how campaigns and messaging get adjusted over time.
These measurements work best together because customer satisfaction has several parts. One customer may like a product but dislike support. Another may report a good experience yet still switch because of price. Tracking several focused metrics gives teams a clearer view.
Customer Satisfaction Metrics: Key Metrics to Track

For a stronger list that matches the SERP while keeping every item distinct, use these 11 customer satisfaction metrics:
1. Customer Satisfaction Score (CSAT)
CSAT measures how satisfied customers feel after a specific purchase, service, or interaction. It is usually collected through a short rating-scale survey.
Formula: CSAT = Positive responses ÷ Total responses × 100
CSAT is useful after support conversations, purchases, appointments, deliveries, and other recent experiences.
2. Net Promoter Score (NPS)
NPS measures customer loyalty by asking how likely someone is to recommend a company, usually on a 0–10 scale.
- Promoters: 9–10
- Passives: 7–8
- Detractors: 0–6
Formula: NPS = % Promoters − % Detractors
It works best for tracking the broader customer relationship rather than a single interaction.
3. Customer Effort Score (CES)
CES measures how easy or difficult customers find a process, such as getting support, placing an order, or returning a product.
A lower-effort experience can reduce frustration, especially during support, checkout, account setup, and returns. CES gives useful context when CSAT is positive, but customers still report that a process takes too much work.
4. First Contact Resolution (FCR)
FCR tracks the percentage of customer problems solved during the first interaction.
Formula: FCR = Issues resolved on first contact ÷ Total issues × 100
A higher FCR can point to effective customer service because fewer people need repeated calls, emails, or support tickets.
Complex problems may require several contacts, so read FCR with issue difficulty in mind.
5. Customer Retention Rate
Customer retention rate measures how many existing customers stay with a business during a set period.
Formula: Retention Rate = (Customers at end − New customers) ÷ Customers at start × 100
Strong retention may support positive satisfaction results, but pricing, contracts, convenience, and switching costs can also affect customer decisions.
6. Customer Churn Rate
Churn rate measures the percentage of customers who leave, cancel, or stop purchasing during a specific period.
Formula: Churn Rate = Customers lost ÷ Customers at start × 100
A rising churn rate may point to service, product, pricing, or experience problems.
Compare churn with CSAT, complaints, and cancellation feedback to better understand why customers leave.
7. Repeat Purchase Rate
Repeat purchase rate shows how many customers return to buy again.
Formula: Repeat Purchase Rate = Repeat customers ÷ Total customers × 100
It works especially well for retail, ecommerce, subscriptions, and repeat-service businesses.
Repeat buying can support positive satisfaction findings, although discounts, convenience, and product availability may also influence purchasing behavior.
8. Customer Complaint Rate
Customer complaint rate tracks how often customers report problems with products, billing, delivery, service, support, or other experiences.
Formula: Complaint Rate = Customer complaints ÷ Total customers or transactions × 100
Complaint categories are often more useful than the total number alone because they can show which problems keep occurring.
9. Customer Service Response Time
Response time measures how long customers wait before receiving the first reply from a support team.
It can be tracked across email, phone, live chat, social media, and support tickets.
Shorter response times can help satisfaction, but speed should not replace service quality. A fast response has little value when it does not address the customer’s concern.
10. Customer Lifetime Value (CLV)
Customer Lifetime Value estimates the financial value a customer may generate during their relationship with a company. CLV is not a direct satisfaction score, but it can show the business effect of long customer relationships.
Comparing CLV with retention, NPS, and repeat purchasing can help teams understand which customer groups provide greater long-term value.
11. Likelihood to Switch (LTS)
Likelihood to Switch measures how likely a customer is to leave a company for a competitor.
A survey may ask customers to rate their likelihood of switching within a certain period. Higher scores can point to weak loyalty, dissatisfaction, pricing concerns, or competitive pressure.
LTS adds another view that NPS does not fully provide. A customer may recommend a company yet still consider changing providers because of price, features, or service problems.
CSAT vs NPS and CES: What is the Difference?
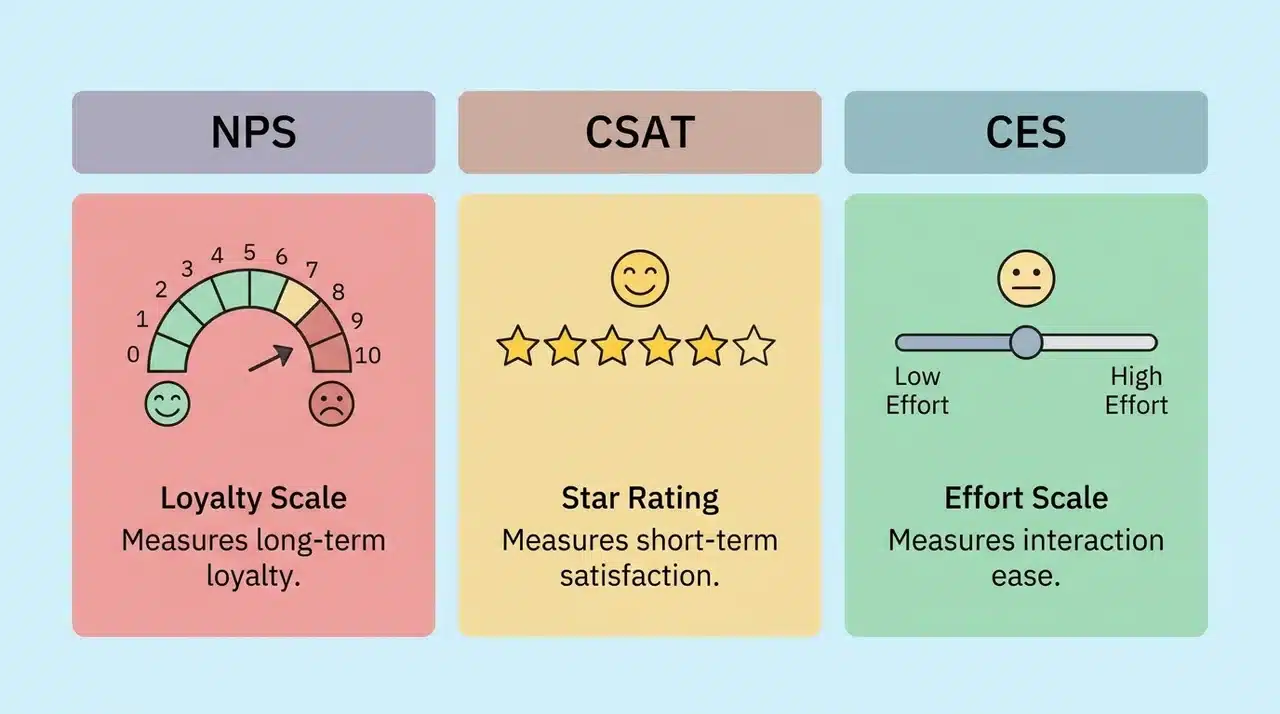
CSAT, NPS, and CES measure different parts of the customer experience. Comparing them side by side helps you choose the right metric for each goal.
| Metric | What It Measures | Main Question | Best Used For |
|---|---|---|---|
| CSAT | Customer satisfaction | Was the customer satisfied? | Recent purchases, support, or service interactions |
| NPS | Customer loyalty | Would the customer recommend the business? | Overall relationships and long-term loyalty |
| CES | Customer effort | Was the experience easy? | Support, checkout, returns, and other customer processes |
CSAT focuses on satisfaction, NPS tracks loyalty, and CES measures effort. Using them together gives you a clearer view of different customer experiences.
How to Measure Customer Satisfaction
Measuring customer satisfaction starts with choosing the right questions, timing, and data. A simple process helps you collect feedback that supports better decisions.
- Set a Clear Goal: Decide what you want to measure, such as a recent purchase, support experience, delivery, renewal, or overall customer relationship.
- Choose the Right Metric: Use CSAT for satisfaction, NPS for loyalty, and CES for effort. Add other metrics only when they support your main goal.
- Ask Simple Questions: Keep survey questions short and focused on one topic. Clear wording makes responses easier to understand and compare.
- Send Surveys on Time: Collect feedback soon after transactions or support interactions. Use periodic surveys when measuring broader customer relationships or loyalty.
- Segment Your Results: Compare responses by product, service type, customer group, location, or support channel to find meaningful differences in satisfaction.
- Track Changes Over Time: Review scores regularly instead of judging one result alone. Consistent tracking helps you spot improvements, declines, and recurring customer issues.
- Compare Feedback With Behavior: Check survey results alongside churn, retention, complaints, repeat purchases, or support activity to understand how customer opinions connect with actions.
A consistent measurement process gives customer feedback more meaning. Focus on useful trends and related behavior so you can identify problems and respond with confidence.
How to Choose the Right Customer Satisfaction KPIs
Choosing customer satisfaction KPIs starts with deciding what the business needs to learn.
- Recent Experience: Use CSAT to measure satisfaction with a transaction or interaction.
- Customer Loyalty: Use NPS to track recommendation intent and broader customer sentiment.
- Customer Effort: Use CES to identify processes that customers find difficult.
- Support Quality: Track FCR, response time, resolution time, and support CSAT.
- Customer Loss: Use churn rate to identify changes in how many customers leave.
- Long-Term Relationships: Track retention rate alongside CLV.
- Recurring Problems: Monitor complaint rate and complaint categories.
- Buying Behavior: Use repeat purchase rate to track how many customers return.
A small set of connected metrics is usually easier to act on than dozens of unrelated numbers. Every KPI should answer a clear business question or help identify a customer problem.
Common Customer Satisfaction Measurement Mistakes
Customer data becomes less useful when teams focus on collecting numbers without considering what those numbers actually mean.
- Tracking Too Much: Large dashboards can make the important signals harder to find. Focus on metrics connected to clear customer or business goals.
- Relying on One Score: A strong NPS does not prove every customer interaction is good. Combine loyalty, satisfaction, effort, and behavioral data where appropriate.
- Ignoring Survey Timing: Asking about an interaction weeks later can reduce response accuracy. Send transactional surveys while the experience is still recent.
- Using Small Samples: A handful of survey responses may not represent the full customer base. Review response volume before making major decisions.
- Chasing Benchmarks: Industry benchmarks can provide context, but changes in a company’s own results often give more useful information.
- Ignoring Comments: A score can show that satisfaction fell, while written feedback may explain the reason behind that change.
- Focusing Only on Speed: Fast support does not always mean good support. Customers still need complete and accurate answers.
Customer satisfaction measurement should lead to useful action. A metric has limited value when nobody investigates changes or uses the findings to fix recurring problems.
Final Thoughts
Customer feedback becomes more useful when each score answers a clear question.
CSAT, NPS, and CES show satisfaction, loyalty, and effort, while FCR, retention, churn, complaints, response time, repeat purchases, CLV, and switching intent add more context.
I see customer satisfaction metrics as a practical way to connect what people say with what they actually do. You do not need to track every number at once.
Start with the measures that match your main goal, then compare changes over time. I also recommend reviewing survey results alongside service and customer behavior data so patterns are easier to spot.
Try these metrics with your own data, and share which ones give you the clearest insight.
Frequently Asked Questions
What Is A KPI For Customer Satisfaction?
A customer satisfaction KPI is a metric tracked over time to measure customer experience. Common examples include NPS, CSAT, and CES.
What Are The 5 Key CX Metrics?
The main CX metrics include NPS, CSAT, CES, churn rate, and customer lifetime value. Together, they show satisfaction, loyalty, effort, and customer behavior.
What Are The Main Ways To Measure Customer Satisfaction?
Businesses measure satisfaction through surveys, customer reviews, retention data, churn tracking, repeat purchases, and support metrics that show customer experiences.
Why Is Customer Satisfaction Important For A Business?
Customer satisfaction helps businesses understand customer needs, improve experiences, reduce customer loss, and build stronger relationships that encourage repeat business.